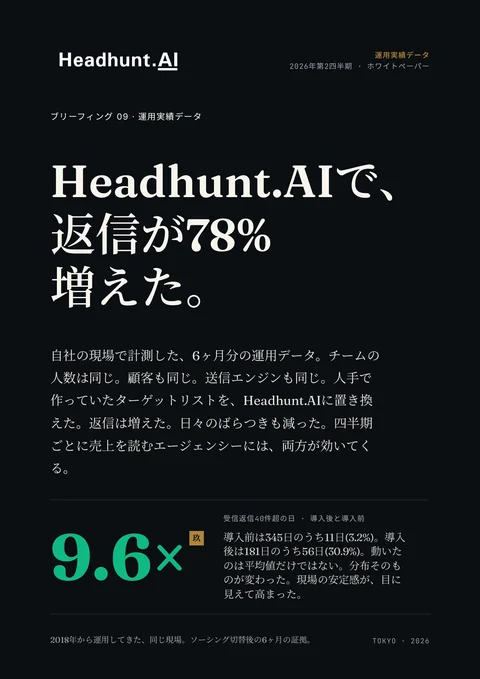
01+78% replies. Same desk.
On November 1, 2025, our agency switched the source of our outbound target lists. The recruiter team size did not change. The outbound sending setup did not change. The scout-mail engine did not change. The only thing that changed: who built the list of candidates to contact. We replaced human-built target lists with Headhunt.AI-generated lists.
Six months later, the production data is unambiguous.
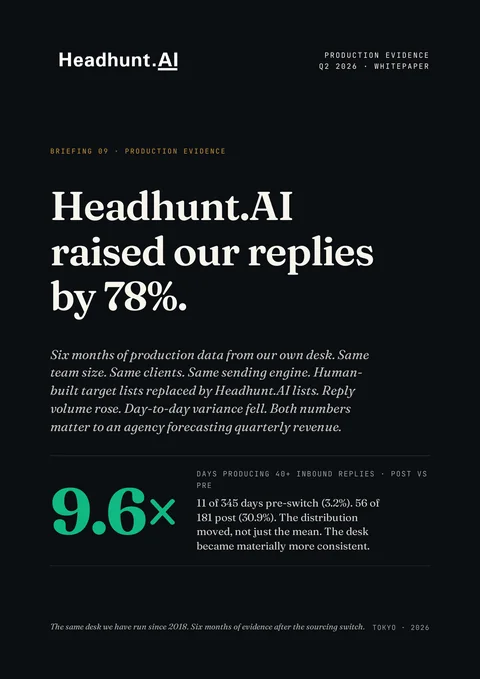
Pre period: 345 days, Nov 21 2024 to Oct 31 2025 (human-built lists). Post period: 181 days, Nov 1 2025 to Apr 30 2026 (Headhunt.AI lists). 526 days, 10,932 inbound replies, one agency desk.
Daily averages rose from 16.4 inbound replies to 29.1. Weekday averages, which control for a weekend-send pause introduced in Q1 2026, rose from 18.2 to 35.8: a 97 percent increase on the cleanest like-for-like comparison the dataset supports.
The volume number is the headline. The distribution number is the operational one. The pre-switch desk depended on a small number of exceptional days to make the month; most days produced little. Post-switch, productive days became the rule — visible in the heatmap further down.
Same desk. Same market. Same engine. Different lists.
02The cleanest test we can run.
The biggest objection to most AI-sourcing case studies is that too many things change at once. New tool, new copy, new team, new market. So you cannot isolate the contribution of the AI itself. Our switch was unusually clean. Here is exactly what we held constant, and exactly what changed.
-
Same recruiter team size.
Headcount held constant across both periods. Same desk, same roles.
-
The same scout-mail engine.
Headhunt.AI's AI scout-mail generator was the sending engine on day one of the measurement window (we adopted it August 1, 2024).
-
Same sending setup.
The outbound stack we were running pre-switch was the outbound stack we ran post-switch, in the same configuration.
-
The same client mix and market.
Mid-market Japan recruiting across the same practice areas (bilingual finance, IT, sales, commercial, HR, marketing).
The one variable. Pre period: human recruiters and researchers built target lists by hand, using LinkedIn Recruiter, ATS searches, and manual sourcing workflows. Post period: Headhunt.AI generated the target lists. Same scout-mail engine wrote the messages. Our team sent them, replied to them, and ran the meetings.
Most AI case studies change five things at once. We changed one.
03A more consistent desk.
Headline averages tell you the mean moved. They do not tell you the shape. For an agency forecasting quarterly revenue, the shape of the reply distribution matters more than the headline number.
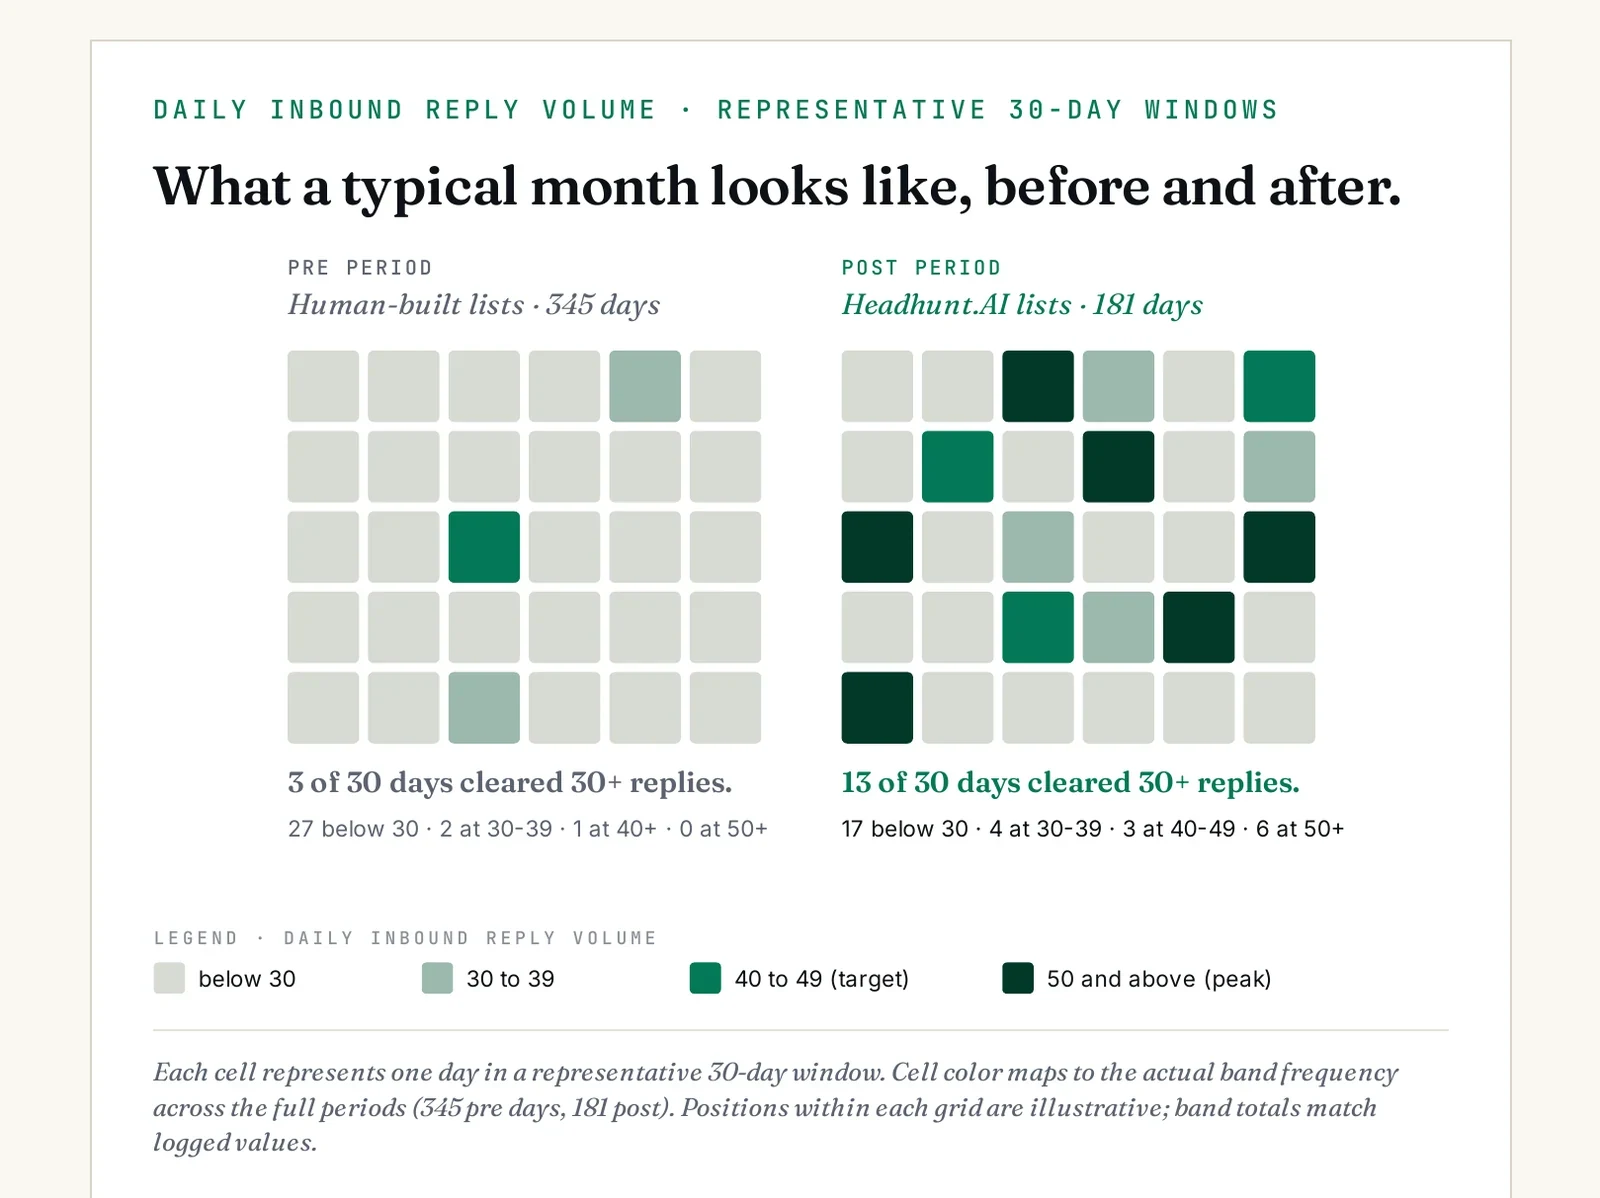
The peaks rose. The valleys mostly disappeared.
04The 17-month picture.
Aggregate averages can hide what is really happening underneath. They smooth over launch ramps, operational dips, and structural breaks. Here is the same dataset, month-by-month, with no smoothing.
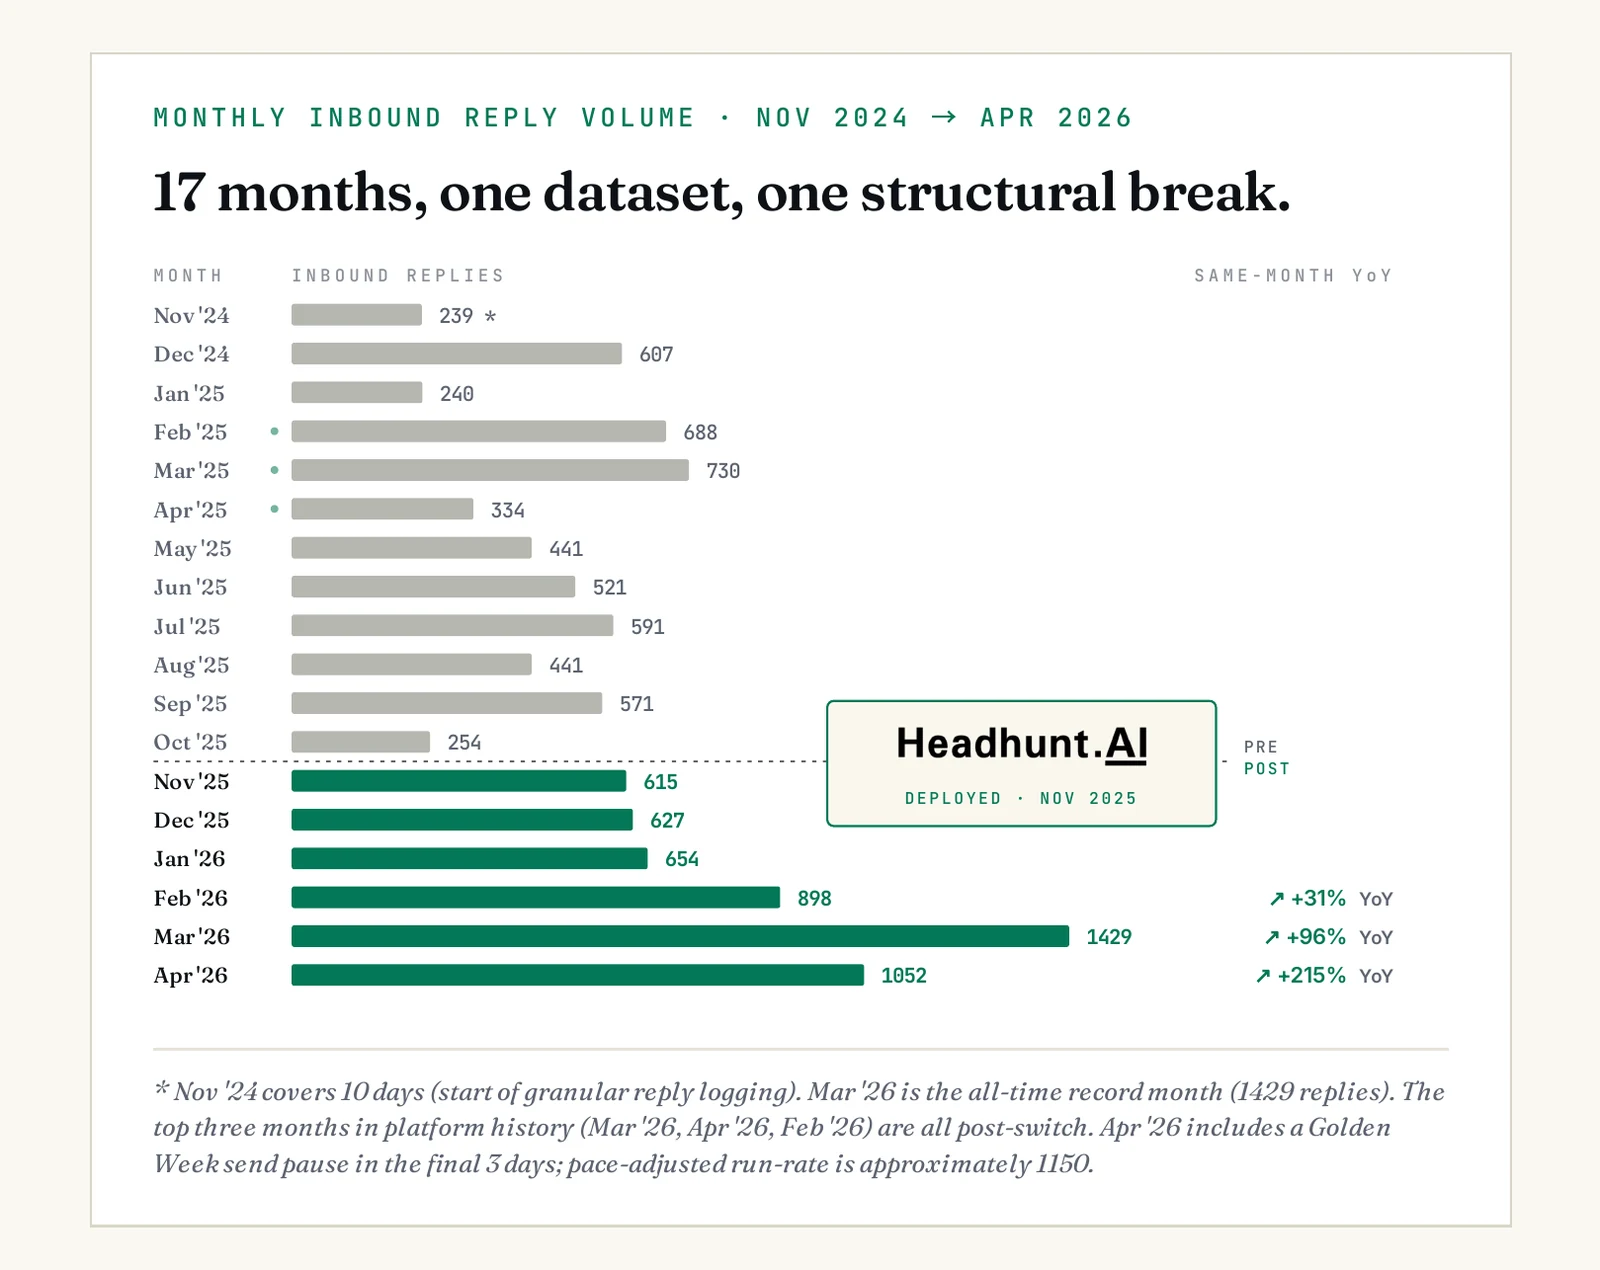
Every all-time platform record was set after the switch.
05What actually changed about the inputs.
The headline metrics above are the visible result. The mechanism behind them is less visible, and worth pausing on. The lift did not come from better-written outreach: the scout-mail engine wrote both the pre-period and post-period messages. It came from who appeared on the target list in the first place.
-
Better-targeted lists, by a measurable margin.
Comparing all human-built target lists against all Headhunt.AI lists for the same role categories on our internal ESAI Score, Headhunt.AI lists score 77 percent higher on average. This is not because recruiters are worse at the task. It is because the AI evaluates every candidate against the full role criteria, including company-tier, tenure pattern, language signal, and career trajectory. A human cannot turn over every stone in a 4M+ profile universe before lunch. The AI can.
-
Larger lists, finding people human searches miss.
Headhunt.AI surfaces candidates by patterns and dimensions that LinkedIn Recruiter and ATS keyword searches cannot encode: career trajectory shape, adjacent-industry experience, latent skill signal, indirect company-tier evidence. It also searches natively in both Japanese and English without the keyword-overlap bias that artificially shrinks bilingual searches.
-
No hidden filtering, in either language.
LinkedIn Recruiter, Bizreach, and most ATS systems quietly bury candidates whose profiles are sparse on the keyword the recruiter typed. A perfect-fit candidate whose profile uses different terminology, or who works in Japanese-only mode, never appears at the top of the results. Headhunt.AI evaluates every profile against the role, then ranks. Sparse-profile candidates whose career signals actually match still surface.
-
Scales infinitely, never has a bad day.
The AI does not take vacation. It does not have a slow Monday. It does not lose focus on the third hour of list-building. It evaluates every candidate against the role with the same rigor on day 181 as on day 1. The only cost is API tokens, which are substantially cheaper than the human labor they replace.
06Why list lifts compound into reply lifts.
Better lists do more than produce more replies. They produce better replies, which deliver compounding effects downstream. Small lifts at each step of the funnel multiply.
-
Right-fit candidates open more often.
Subject lines that name the candidate's actual role resonate; generic ones do not. Spam complaints drop in parallel, which improves deliverability across email and LinkedIn.
-
Relevant outreach gets relevant replies.
Reply rate rises with no change to the engine, the sender, or the volume of messages. Q1 2026: +13.8% reply rate.
-
More replies turn into more meetings.
Meeting conversion stays roughly constant; the gain at reply rate flows directly into the meeting count. +38% more meetings per recruiter, same cohort.
-
Better-fit candidates clear interviews more often.
The candidates who actually match the role survive client interview loops at a higher rate. +13.5% interview pass rate.
-
Offers land. More candidates accept.
Candidates who genuinely fit are more likely to accept. +14% offer acceptance rate.
The list is the most consequential variable in the funnel. Everything downstream inherits its quality.
07Production proof, across the funnel.
If the reply-rate lift were a top-of-funnel artifact, it would not survive contact with client interview loops. It would not survive offer stage. It would not show up in placements. We can check this directly: the same agency that ran the inbound-reply test also tracks every other stage of the recruiting funnel. Here is Q1 2026 versus Q1 2025, same desk.
ESAI Agency production data. Q1 2026 (Jan–Mar 2026, post-switch) compared to Q1 2025 (Jan–Mar 2025, human-built lists). Same desk, same market segments, same fee structure.
These are not lab numbers. The desk that handled the inbound replies in the 526-day reply log also ran the meetings, sat in the interview debriefs, and closed the offers. Each stage above is a separate, independent measurement of the same underlying mechanism: better-targeted lists, applied to the same downstream operation.
A reply lift that does not survive to offer is a vanity number. This one survives.
08And the team got their week back.
The reply data is the headline. But the other consequence of the switch is something most agency principals care about more than reply rate: recruiter capacity. When the AI builds the list, the recruiter does not.
What 20 to 30 percent of a recruiter week actually looks like. List-building is not a glamorous task, but it is a heavy one. Manual sourcing on a single role can consume 4 to 6 hours: defining boolean strings, scrolling LinkedIn Recruiter, cross-referencing past ATS data, exporting and de-duping. Across a recruiter's open desk, that adds up to between one and one-and-a-half full working days per week. The AI does this in 90 seconds.
Where the recovered hours actually go. The recovered time does not disappear. It moves up the funnel: into more candidate meetings, into deeper client debriefs, into reference checks, into structured close conversations. The +38% lift in meetings per recruiter is fed in part by the reply-rate increase, and in part by the simple fact that recruiters have time to take more meetings now that they are not building lists.
In dollar terms, this is the gain that matters most. A recruiter's billable output is bounded by hours, not by available roles. Recovering 20 to 30 percent of those hours is equivalent to adding 0.2 to 0.3 of a new recruiter, at zero headcount cost.
The biggest cost of manual sourcing is not the time spent. It is the meetings you do not take because you spent it.
09What we hear from skeptics.
We have shown this data to peer agency principals, hiring leaders, and operators inside competing AI sourcing vendors. Six objections come up repeatedly. Here they are, with honest answers.
"The post period coincides with another operational change. You added a weekend send pause. The list change isn't fully isolated."
Fair pushback. The weekend pause is the only other operational change in the post period, and we name it in the methodology. It changes the denominator on daily averages (weekends are excluded from sending) but not on weekday averages. That is why the cleanest single number we can show is the weekday average, which controls for the pause: +97%. The +78% headline is the combined effect; +97% weekday is the cleanest like-for-like read.
"Six months is not enough. Show me two years."
We agree more time is better. The constraint is that granular reply logging only started in Nov 2024, and the switch was Nov 2025. So six months is what we have. But six months covers 181 production days, 5,275 inbound replies, and includes a full quarterly cycle plus the Q1 selling season. The signal is large enough that random variation cannot account for it: the pre-period's single best month (730 replies, Mar 2025) is below the post period's average month (879 replies).
"Your recruiters got better at the job. That is the lift, not the AI."
This objection assumes recruiters produce the replies. They do not. Headhunt.AI handles candidate search, scout-mail generation, and outbound sending; recruiters are not in the loop that produces the reply numbers. Whatever recruiters learn over time affects what happens after a reply lands (meeting prep, screening conversation, role pitch), not whether the reply happens at all. Recruiter learning is a real effect, but it is at a different funnel stage from the one this brief measures. It was accounted for by structure, not by control.
"Headhunt.AI just scrapes LinkedIn. We could build the same lists ourselves."
The data source is primarily public LinkedIn, plus signal from X, GitHub, Facebook, and Instagram. We do not claim a proprietary database. What we claim is the proprietary scoring system that evaluates 4M+ Japan profiles against any role's specific criteria in under two minutes. You can theoretically reproduce that, but it would cost two engineers about 18 months and several hundred thousand dollars in compute before the first useful list. Or you can run a search on our system in the same two minutes.
"Our market is different. Your data is from your desk, not ours."
Headhunt.AI targets hiring inside Japan, so "different market" really means a different industry or different role coverage within Japan. Across every industry and role type we have measured against (tech, finance, sales, commercial, HR, marketing, multilingual roles, executive search), the same pattern shows up: better relevance produces more replies. The mechanism — a 4M+ Japan-focused profile pool, scored against your exact role criteria, replacing manual boolean searches — is industry-agnostic. Absolute numbers will vary by segment; the direction of the lift does not.
"If this is real, why is everyone not on AI sourcing already?"
Three reasons. First, until recently the candidate-scoring models were not good enough; the lists they produced did not actually beat human researchers, and the early adopters of those generations got burned. Second, the model generation that does beat human researchers (post-GPT-4-class) only became practical for bulk evaluation in 2024. Third, agency operators evaluating these tools usually do so by demo, not by side-by-side production test, which understates the lift. The market is catching up; the question is whether you catch up before or after your competition.
The right way to decide is not to argue about it. It is to test it on one of your own roles.
10A test you can run this week.
All of this is theory until you put it in front of your own recruiters on your own roles. Here is the cleanest way to do that without a procurement cycle, an integration project, or a vendor contract.
500 ranked, scored Japan candidates against one of your real open roles. No contract. No setup. No integration.
-
Buy a ¥75,000 credit pack.
500 credits, no subscription, no annual commitment. Credits never expire. Each credit returns one ESAI-scored candidate matched against the role you describe.
-
Pick one open role you would normally source manually.
Mid-market, contingent, in a segment where AI scoring works well (bilingual finance, IT, sales, commercial, HR, marketing, or similar). Paste the JD. Headhunt.AI returns up to 1,000 ranked candidates from our 4M+ profile Japan database in 1 to 2 minutes.
-
Show the list to the recruiter who owns that segment.
Ask one question: "Are there candidates on this list you have not already seen through your normal sourcing?" If yes, even a handful, Headhunt.AI is finding people your current process is missing. That is your proof of concept, on your data, in under an hour.
Running a structured side-by-side test? We provide a tracking template at no extra cost. Email sales@executivesearch.ai.
11Eight questions worth asking inside your team.
The right starting question is not "should we adopt AI sourcing." It is a set of operational diagnostics. The point is not to count check marks. It is to find which of these your team can answer with real numbers, and which only in generalities. The second list is where the work is.
-
Do you know your weekday inbound reply average, measured rather than estimated, over the last 90 days?
-
Do you know your reply rate by candidate quality decile, or only on overall blended averages?
-
What percentage of your recruiter week goes to list-building and qualification, measured in a 30-minute calendar audit? Most teams guess 40 to 50%. Audits land at 60 to 70%.
-
Do you know the distribution of high-volume reply days month-to-month, or only the average?
-
What is your average time from JD intake to first qualified shortlist over the last 12 months? If rising, you are losing ground.
-
Have you ever tested an AI sourcing tool side-by-side with manual sourcing on a real open role, with the same recruiter handling both?
-
If a peer agency announced 1.97× reply volume per recruiter at your fee tier tomorrow, what is your concrete response in the next 30 days?
-
What fraction of your recruiters can name the company-tier, tenure pattern, and language signal that defines a perfect-fit candidate for each open role?
7–8 specifics. Operating at the level needed to evaluate AI sourcing rigorously. Run a side-by-side on one real open role.
5–6 specifics. Strong measurement on what you instrument. Gaps likely on distribution-of-outcomes.
3–4 specifics. You run on a mix of measurement and intuition. Instrument the inbound reply distribution before evaluating tools.
0–2 specifics. Competing against measured competitors. The gap is wider than it looks from the inside.
12The honest take.
The agencies and in-house teams that decide AI sourcing is real will spend the next 18 months building the operational habits, measurement systems, and candidate pipelines that come with it. The teams that decide it is not real will spend the same 18 months operating at their current capacity, against competitors operating at 1.5 to 2× theirs, on the same fee structures.
The reply data above is not a forecast. It is a record of what already happened on our desk, in production, with the same people doing the same work. There is nothing exotic in the setup. The only thing we changed was the list.
The lift is not just larger. It is steadier. The day-to-day variance fell. That is what makes the revenue line behind it something an agency can actually plan around.
Everything else here is a corollary. The 77% lift in ESAI Scores explains why the reply rate rose. The reply rate explains why meetings rose. Meetings explain why placements rose. Placements explain why margins improved on a structurally smaller fee pool. The mechanism is plain and the math is plain. The decision to test it on your own desk is the only step you have not yet taken.
These systems are the worst they will ever be today. The pace of improvement in AI is not linear — invest now to stay ahead of your competition, or fall behind.
This is uncomfortable to read. It is more uncomfortable to act on. Doing nothing is a decision, the same as any other. It just looks more like the present, which makes it feel safer than it is.